

Google Analytics is, without a doubt, the most powerful analytics tool that every website owner should be using. Not to mention, it’s totally, 100%, unequivocally FREE for life. It’s also really easy to use when you know what information you want to track.
You may be thinking, “Why do I need a powerful analytics tool for my website?” Well, now that you have a website live on the world wide web, don’t you want to see how it’s performing? Don’t you want to know how many people are coming to your website and how they are finding you online?
One of the biggest things we teach our clients at LAIRE is that nothing you do in marketing is set in stone. The tools you use to achieve your goals and the messaging you use to reach your ideal clients are all fluid.
That’s why you need to see the numbers and do a little research into what’s working and what isn’t. Just because your website is live, doesn’t mean you can set it and forget it. There is always room for improvements and tweaking.
I’m going to walk you through my three favorite basic areas of Google Analytics that you can use to take the pulse of your website. (Keep in mind, this guide is for Google Analytics beginners.)
Google Analytics Basics 1 - AUDIENCE

Let’s start with the Audience Overview section. This is the section that will give you an overview of your visitors’ habits on your website.
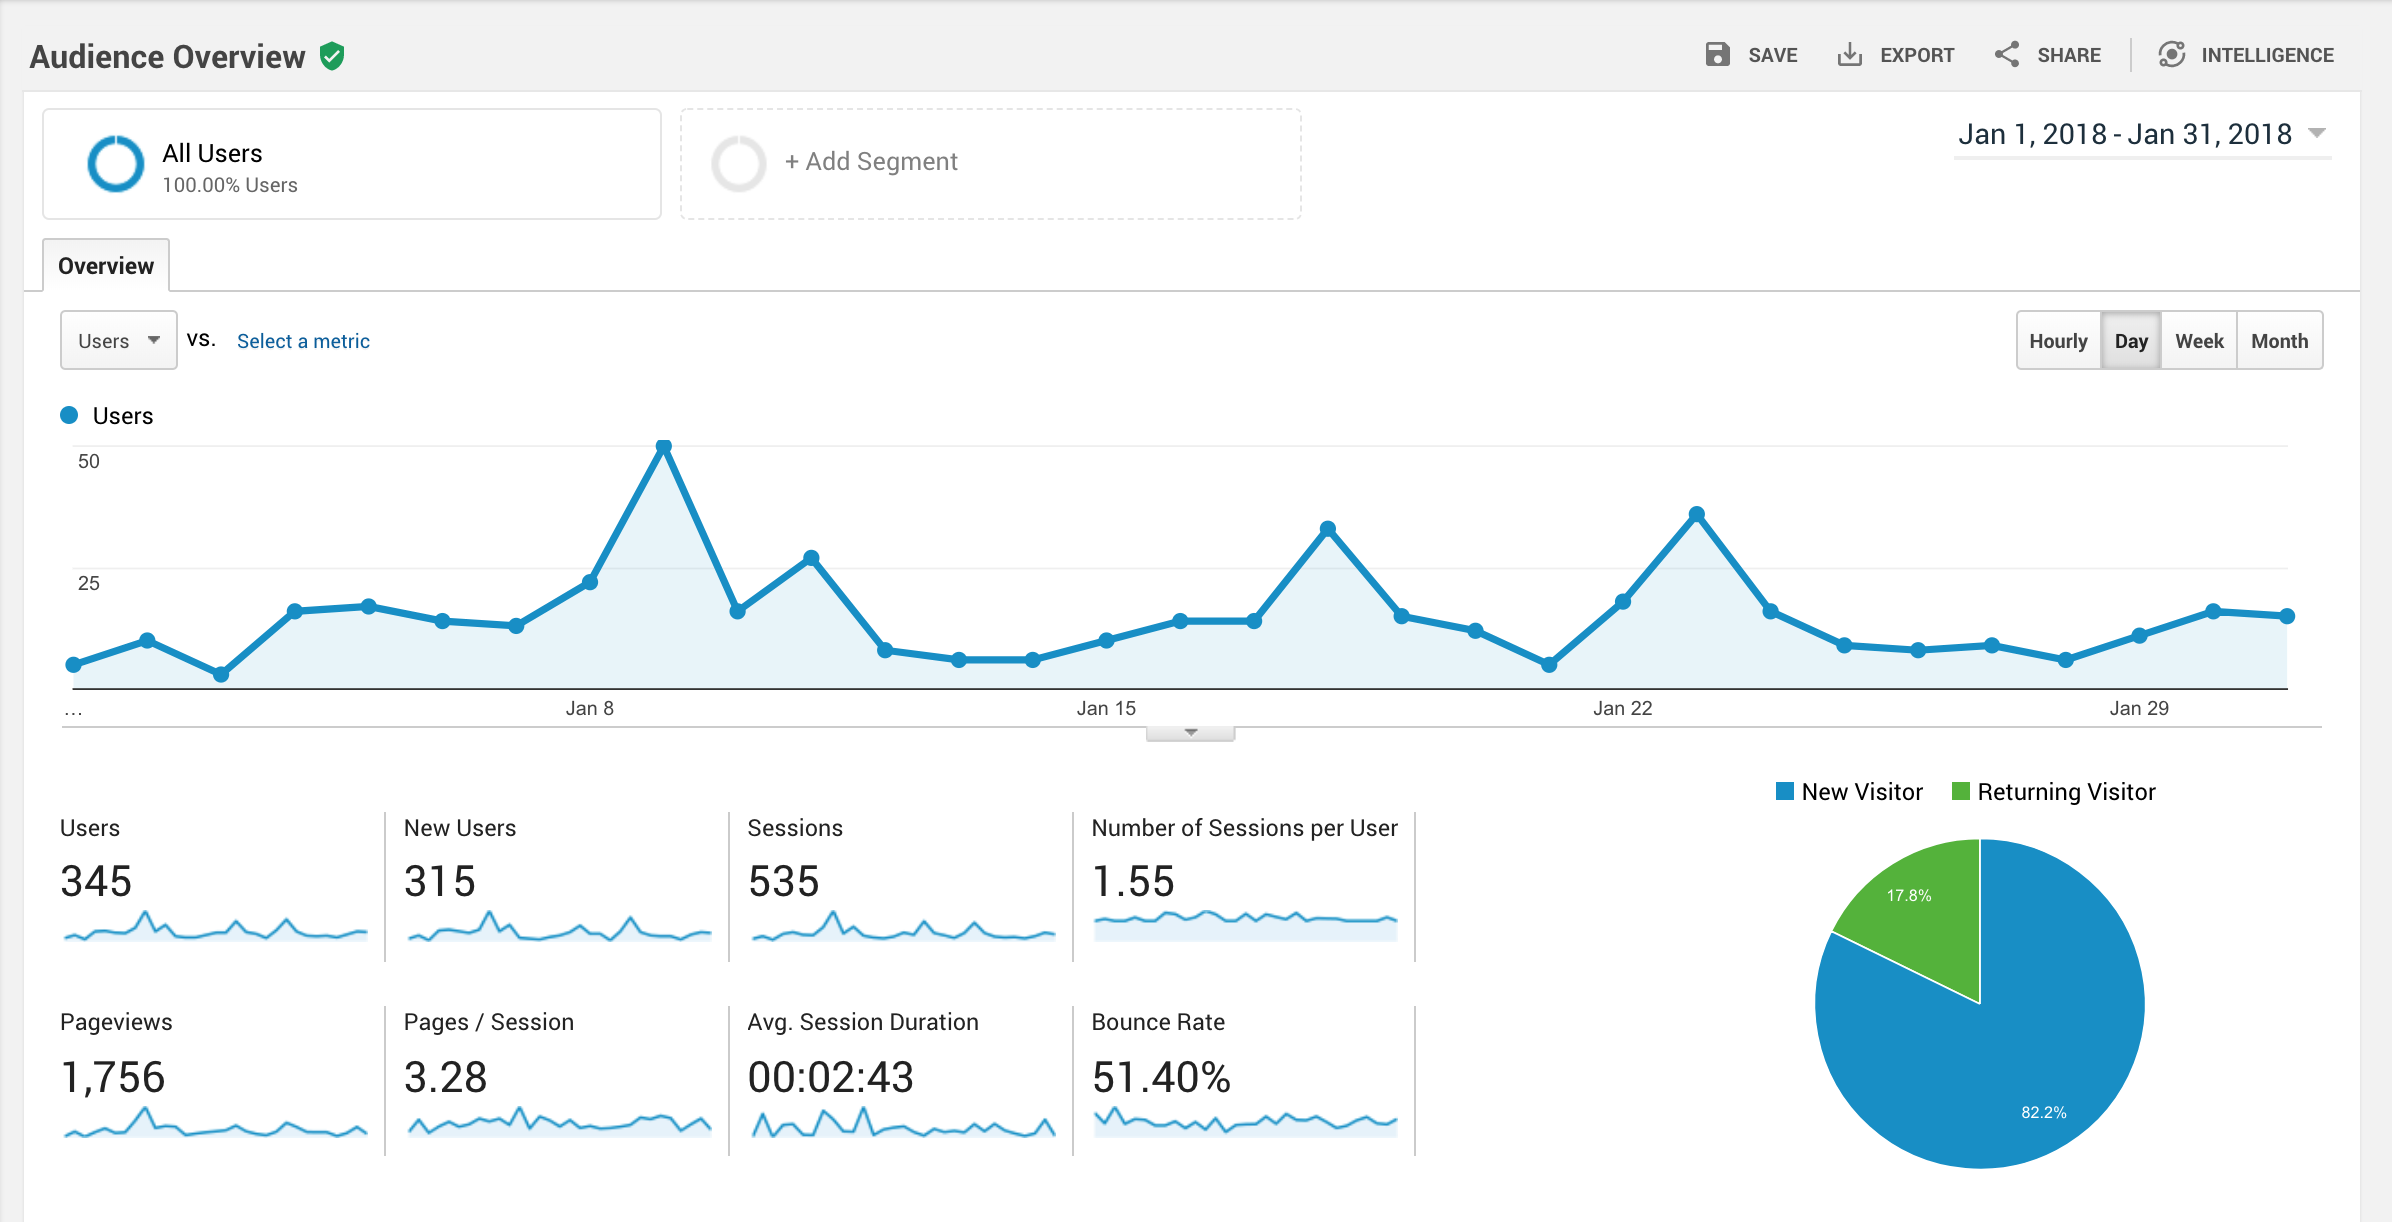
You can get a pretty good overview of what your website visitors (or audience) are doing once they get to your website. Here are some definitions to help you understand this section.
Sessions are groups of interactions a single user makes with your website over 30 consecutive minutes. This means that whatever an individual user does before they leave your site equals one session, for example, navigating multiple pages, downloading resources, filling out forms and more.
Users are individual visitors who view your website, tracked by their devices and differentiated by their IP address.
New Visitors are people who have not visited your website before.
Returning Visitors are people who have visited your website before and are returning for more content, aka, people you know or people who know you.
Page Views are how many individual pages all of those users viewed over the course of their sessions on your website.
Pages / Session represents the average number of pages each user views during a session on your website.
Average Session Duration is how long your users stay on your website.
Bounce Rate is the percentage of users who leave your website after only viewing one page.

Why use the Google Analytics Audience feature?
You ideally want your bounce rate to be very low (an excellent bounce rate is 26 percent – 40 percent), although up to 55 percent is about average. This low number means the majority of your visitors are hanging around your website, clicking to another page for more information. Users may get everything they need from just one page, depending on how your website is structured. So a higher number, up to 70 percent, may still be fine. Above 70 percent, you can infer that users are only coming for individual blogs, news articles or other quick links, and not clicking around to your other pages.
Google Analytics Basics 2 - ACQUISITION

Next, let’s look at the Acquisition Overview section. This is where you see how your audience found your website.
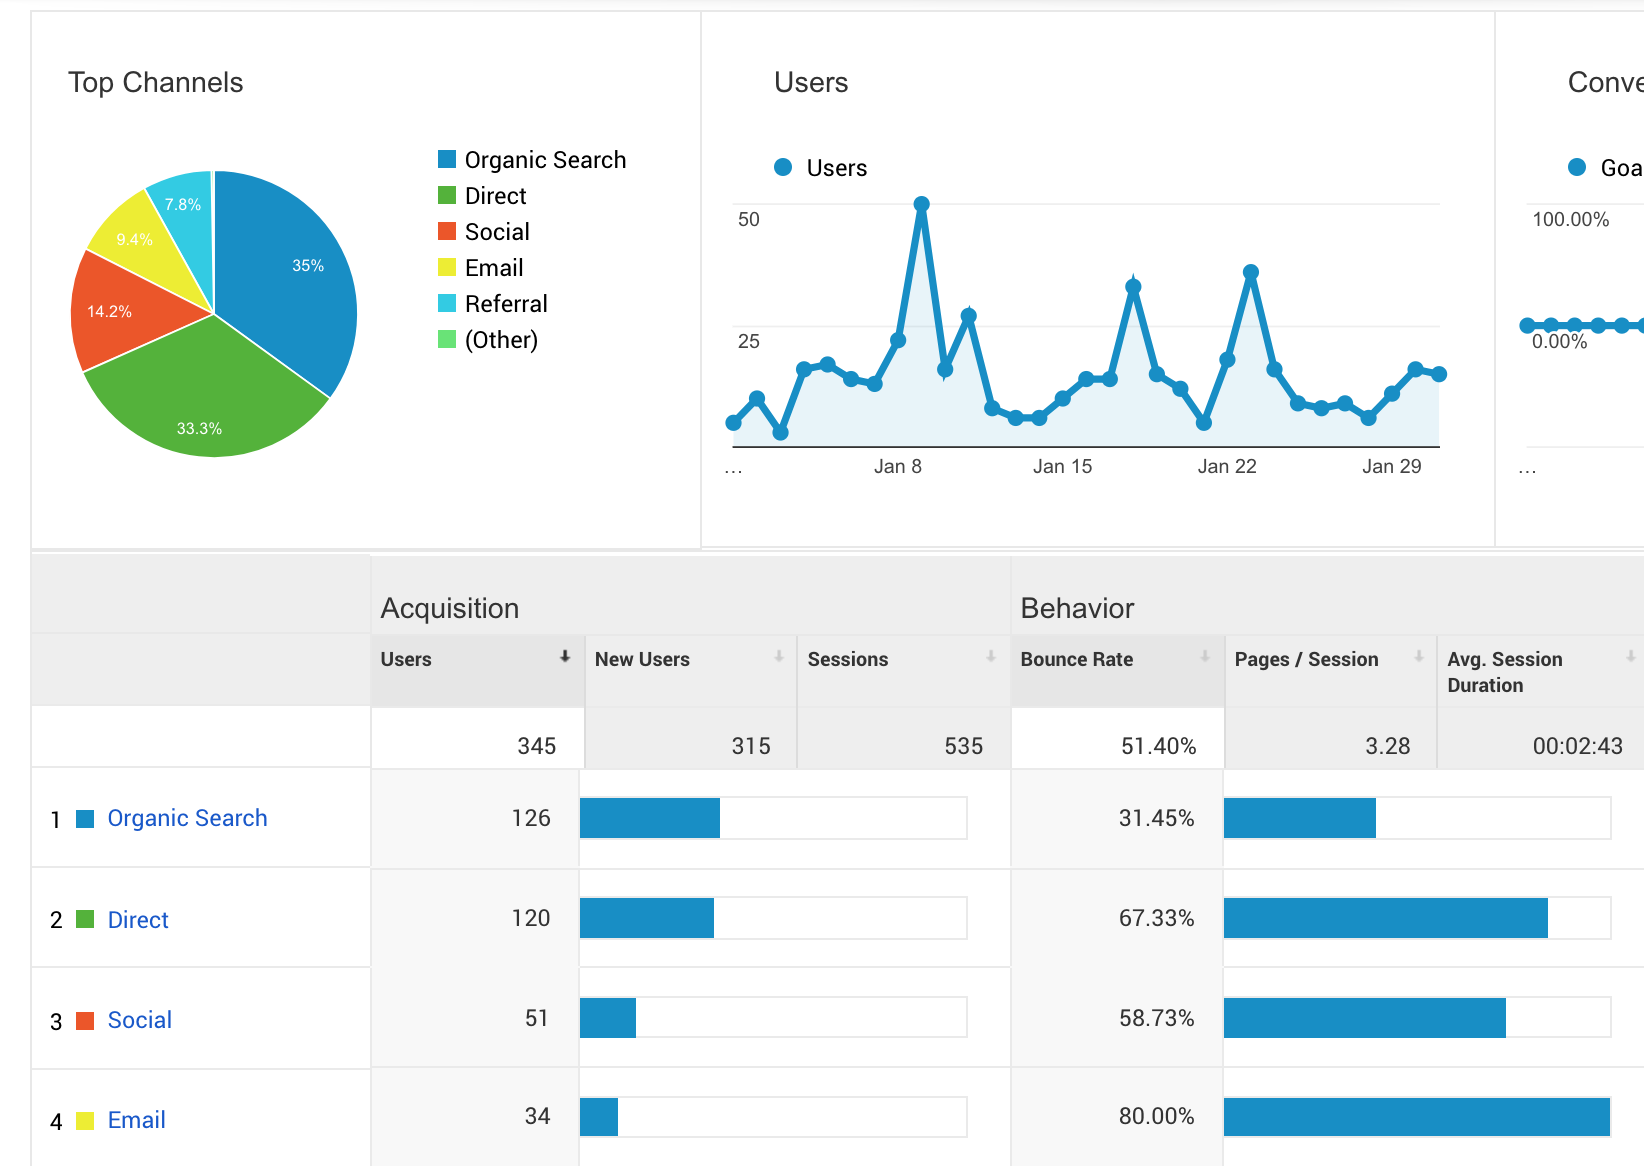
You can get a great overview of what channels your website visitors are using to find information and where your presence is the strongest. Here are some definitions to help you understand this tool.
Direct Traffic is made up of the visitors who come to your website using a direct URL either by typing it directly into their browser, using bookmarks they have saved or other un-trackable channels.
Organic Search traffic is made up of the visitors who come to your website from a search engine. This means your website appeared in a search for a specific keyword and they clicked your link.
Social media traffic comes from your posts and profiles on a number of social media channels such as Facebook, Twitter
Email traffic means someone clicked on a link that you included in an email.
Referral traffic comes from people clicking on a link to your website from another website, like a directory or partner.
Why use the Google Analytics Acquisition feature?
You can use this data to monitor your marketing efforts by channel. Ideally, you want your traffic to be dispersed across these channels, but your organic and direct traffic will normally be the highest numbers. See if your SEO strategy is working by what percent of your traffic is coming from organic search. Monitor your ROI for social media and email efforts by seeing how many people click on the links you share. This way you know where to focus, or diversify, your efforts and test your most effective channels.
Google Analytics Basics 3 - BEHAVIOR

Lastly, let’s look at the Behavior Overview section in your Google Analytics account. This is where you see what your audience is spending the most time looking at on your website.
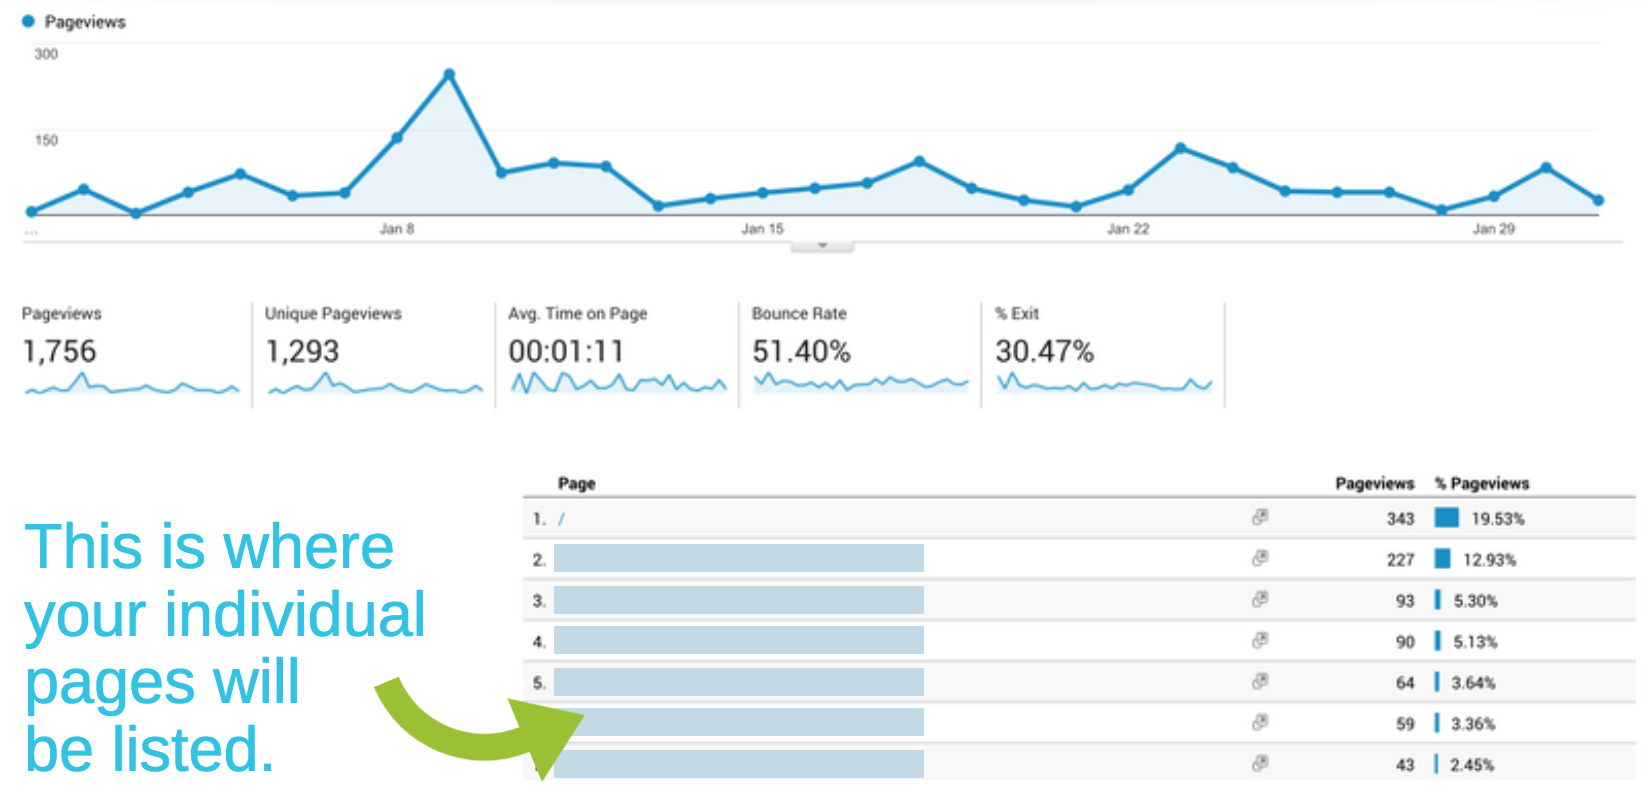
Here you can see what pages had the most page views over a specific period of time. This time period can be adjusted in the top right corner of your Google Analytics dashboard.
Your home page will typically be the most viewed page. Check this periodically to see what pages are being found the most and make sure the information on those pages is the most relevant to your visitors.
This is a great way to see which blog posts are performing the best, what services visitors are most interested in and more.